Daily updated maps with analysis and forecast of arctic stratospheric temperature and vortex position.
The maps may be viewed as html animations or as kmz archives to be shown in Google Earth.
Each set of maps holds files corresponding to analysis and forecasts at 6 potential temperature levels: 400, 475, 550, 675, 950 K.
The files will be updated at 07:50 UTC and the old files will be removed.
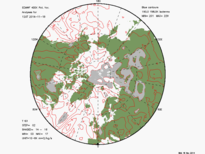
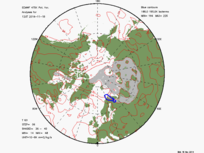
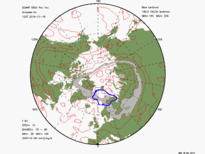
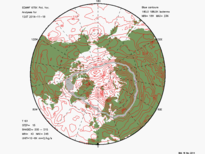
Each file holds the analysis and 10 days forecast maps, each at 12:00 UTC. The map shows the vortex edge position (red shade) and the type 1 and 2 PSC (synoptic) temperature threshold (10 ppbv HNO3 [blue contour line] and 5 ppmv H2O [thick blue contour line]).
Click on maps below to start animation.
675K
 |
950K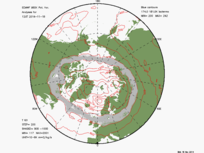 |