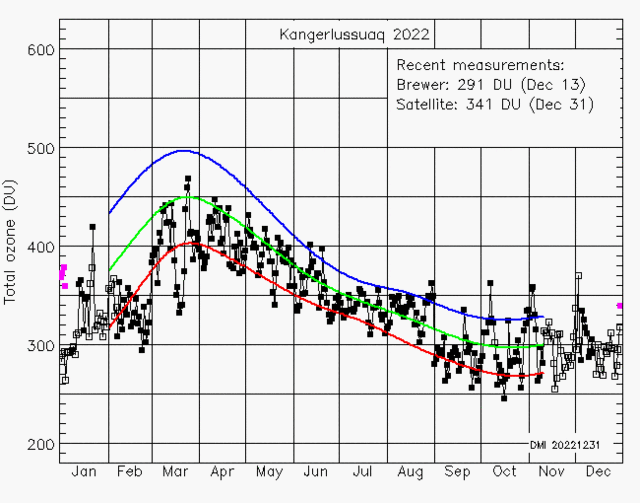
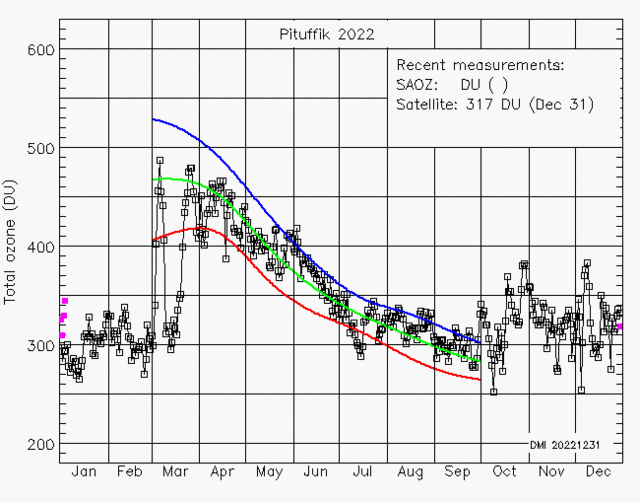
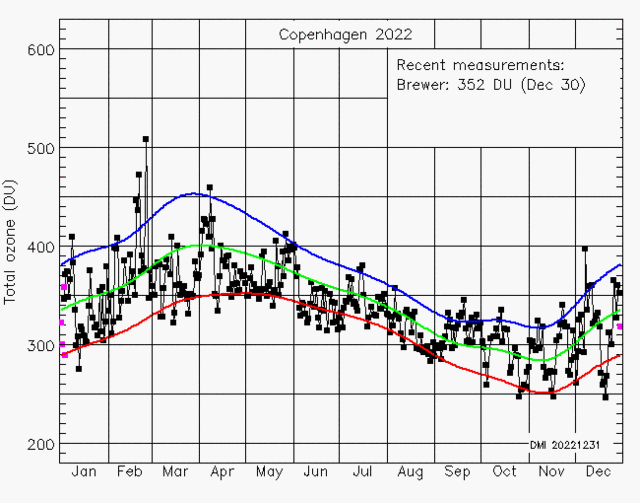
Ozon layer thickness over Greenland and Denmark 2022
Filled black squares = DMI measurements.
Filled red squares = Sonde measurements
Open squares = Assimilated GOME-2 (Metop B)
Green curve = satellite average measurements from 1979-1988 (NASA-TOMS)
Blue and red curve = average plus/minus one standard deviation
Pink filled squares: Five days forecast


